Design Practitioners' Perspectives on AI Transformation

1 Overview
- A survey project to inform the development of a platform supporting the design industry’s transition to AI. We explored how design practitioners in Korea use generative AI and big data, and what they expect and worry about.
- Over roughly three months in 2024, we collected 538 valid responses from design practitioners and industry stakeholders. We combined descriptive statistics, thematic analysis of open-ended responses, and structural equation modeling to examine data use, perceptions of AI, bottlenecks in the design process, and skills needed for the future.
- Role: Survey design, distribution strategy and execution, response collection, descriptive statistical analysis, thematic analysis, and structural equation modeling
 Key survey findings at a glance
2 Context
Before considering how to support the design industry’s transition to AI, we needed to understand how these technologies were actually being used in design practice, and where people were running into difficulties.
We were particularly interested in how AI and big data might support creative work, and what conditions and skills practitioners would need to use them.
We surveyed design practitioners and industry stakeholders across Korea to gather a foundation for discussing the direction of a platform for AI and data use throughout the design process.
3 Approach
3-1 Designing the Survey
The survey included 10 background questions and 40 required questions: 34 multiple-choice and 6 open-ended.
- Multiple-choice questions
- Design process and data environment (6)
- Data-driven design (6)
- Understanding AI’s role (7)
- Addressing bottlenecks (9)
- Future skills (6)
- Open-ended questions: Experiences using AI in design projects, problems AI cannot solve, features needed to collect and share data, the roles of the government and KIDP in supporting AI and big data use, and the skills future designers will need.
We also planned to use structural equation modeling (SEM) to look beyond response distributions and explore relationships between perceptions and behavior. Drawing on the Technology Acceptance Model (TAM)1 and related studies, we defined key variables and hypotheses and selected questions using a five-point Likert scale for analysis.
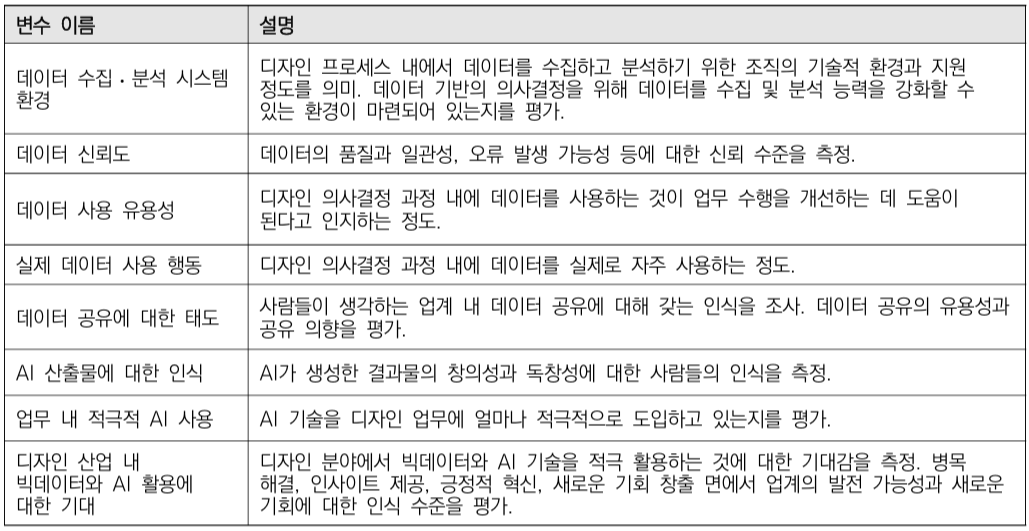 Key variables used in the structural equation model
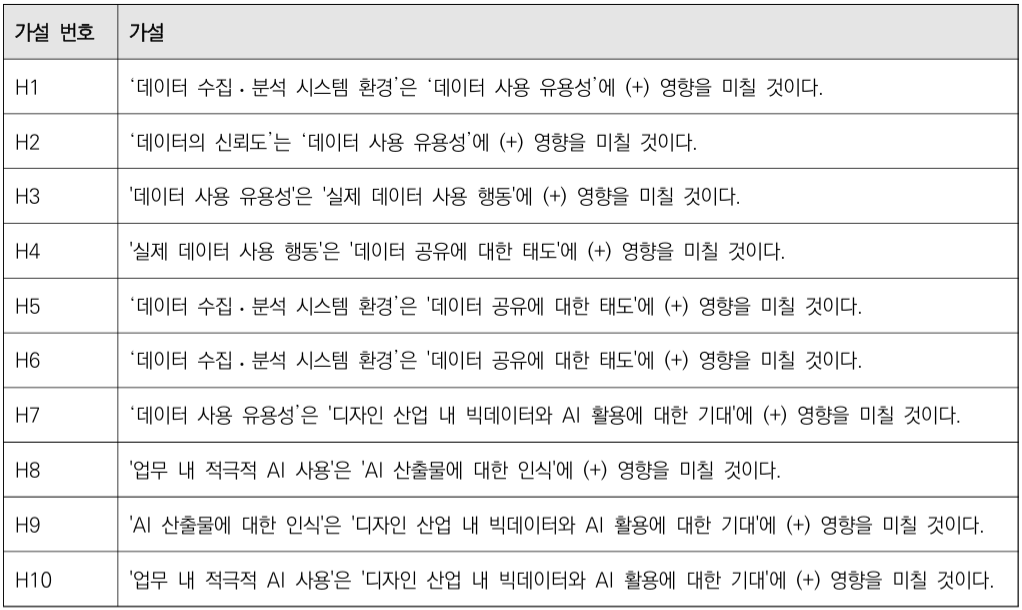 Hypotheses tested in the structural equation model
3-2 Reaching Practitioners
We invited two groups of people involved in the design process:
- Design practitioners: In-house and freelance designers, employees of design firms, design researchers, educators, and others
- Design project stakeholders: Planners, managers, engineers involved in implementing designs, and others
To reach people working in different settings, we shared the survey through KIDP DesignDB emails and newsletters, design firms’ websites, KIDP’s official social channels, our research team’s channels, and the AI Design Association community.
We also contacted 535 design firms on a list compiled by the research team.
 Sample images used to promote the survey
The survey ran from July 25 to October 31, 2024. After excluding duplicate and other invalid responses, we used 538 responses in the analysis.
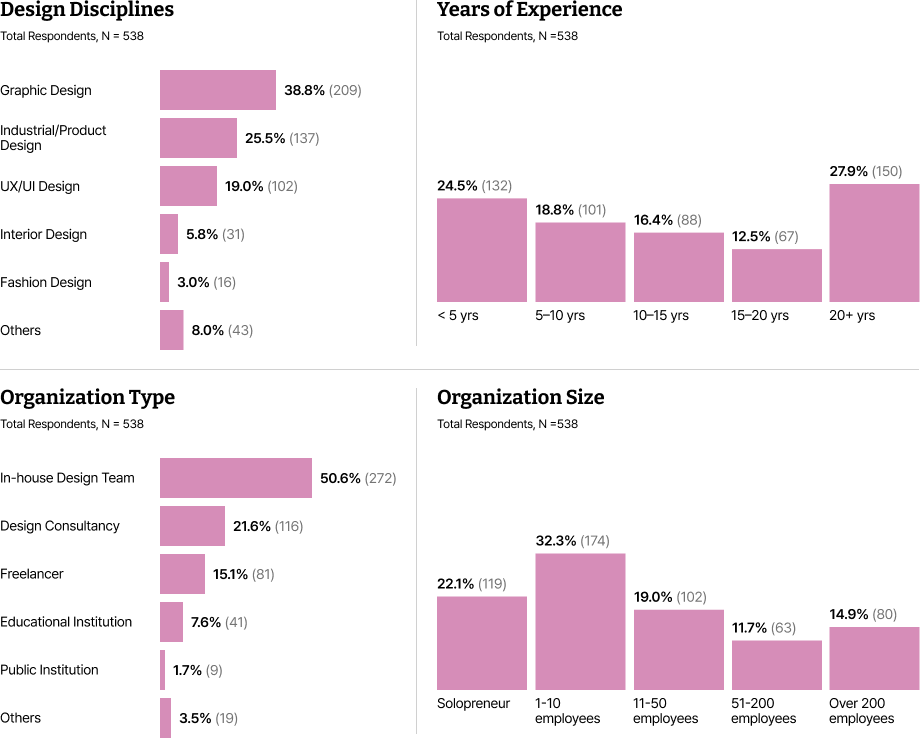 Respondent demographics
3-3 Analyzing the Responses
We looked at the responses in three different ways.
- Descriptive statistics We examined response distributions and averages across the five survey themes to identify broader patterns in data use, expectations of AI, design-process bottlenecks, and future skills.
- Thematic analysis of open-ended responses We reviewed written answers to each question and identified recurring themes. This helped us understand the specific benefits and limitations of AI, the needs surrounding data use, and expectations for institutional support.
- Structural equation modeling Using five-point Likert-scale responses, we conducted confirmatory factor analysis and SEM to assess the measurement items and statistically test the hypothesized relationships between data use and perceptions of AI.
4 Outcome
4-1 What the Multiple-Choice Responses Showed
Design Process and Data Environment
Practitioners recognized the need for data, but many lacked the systems to work with it.
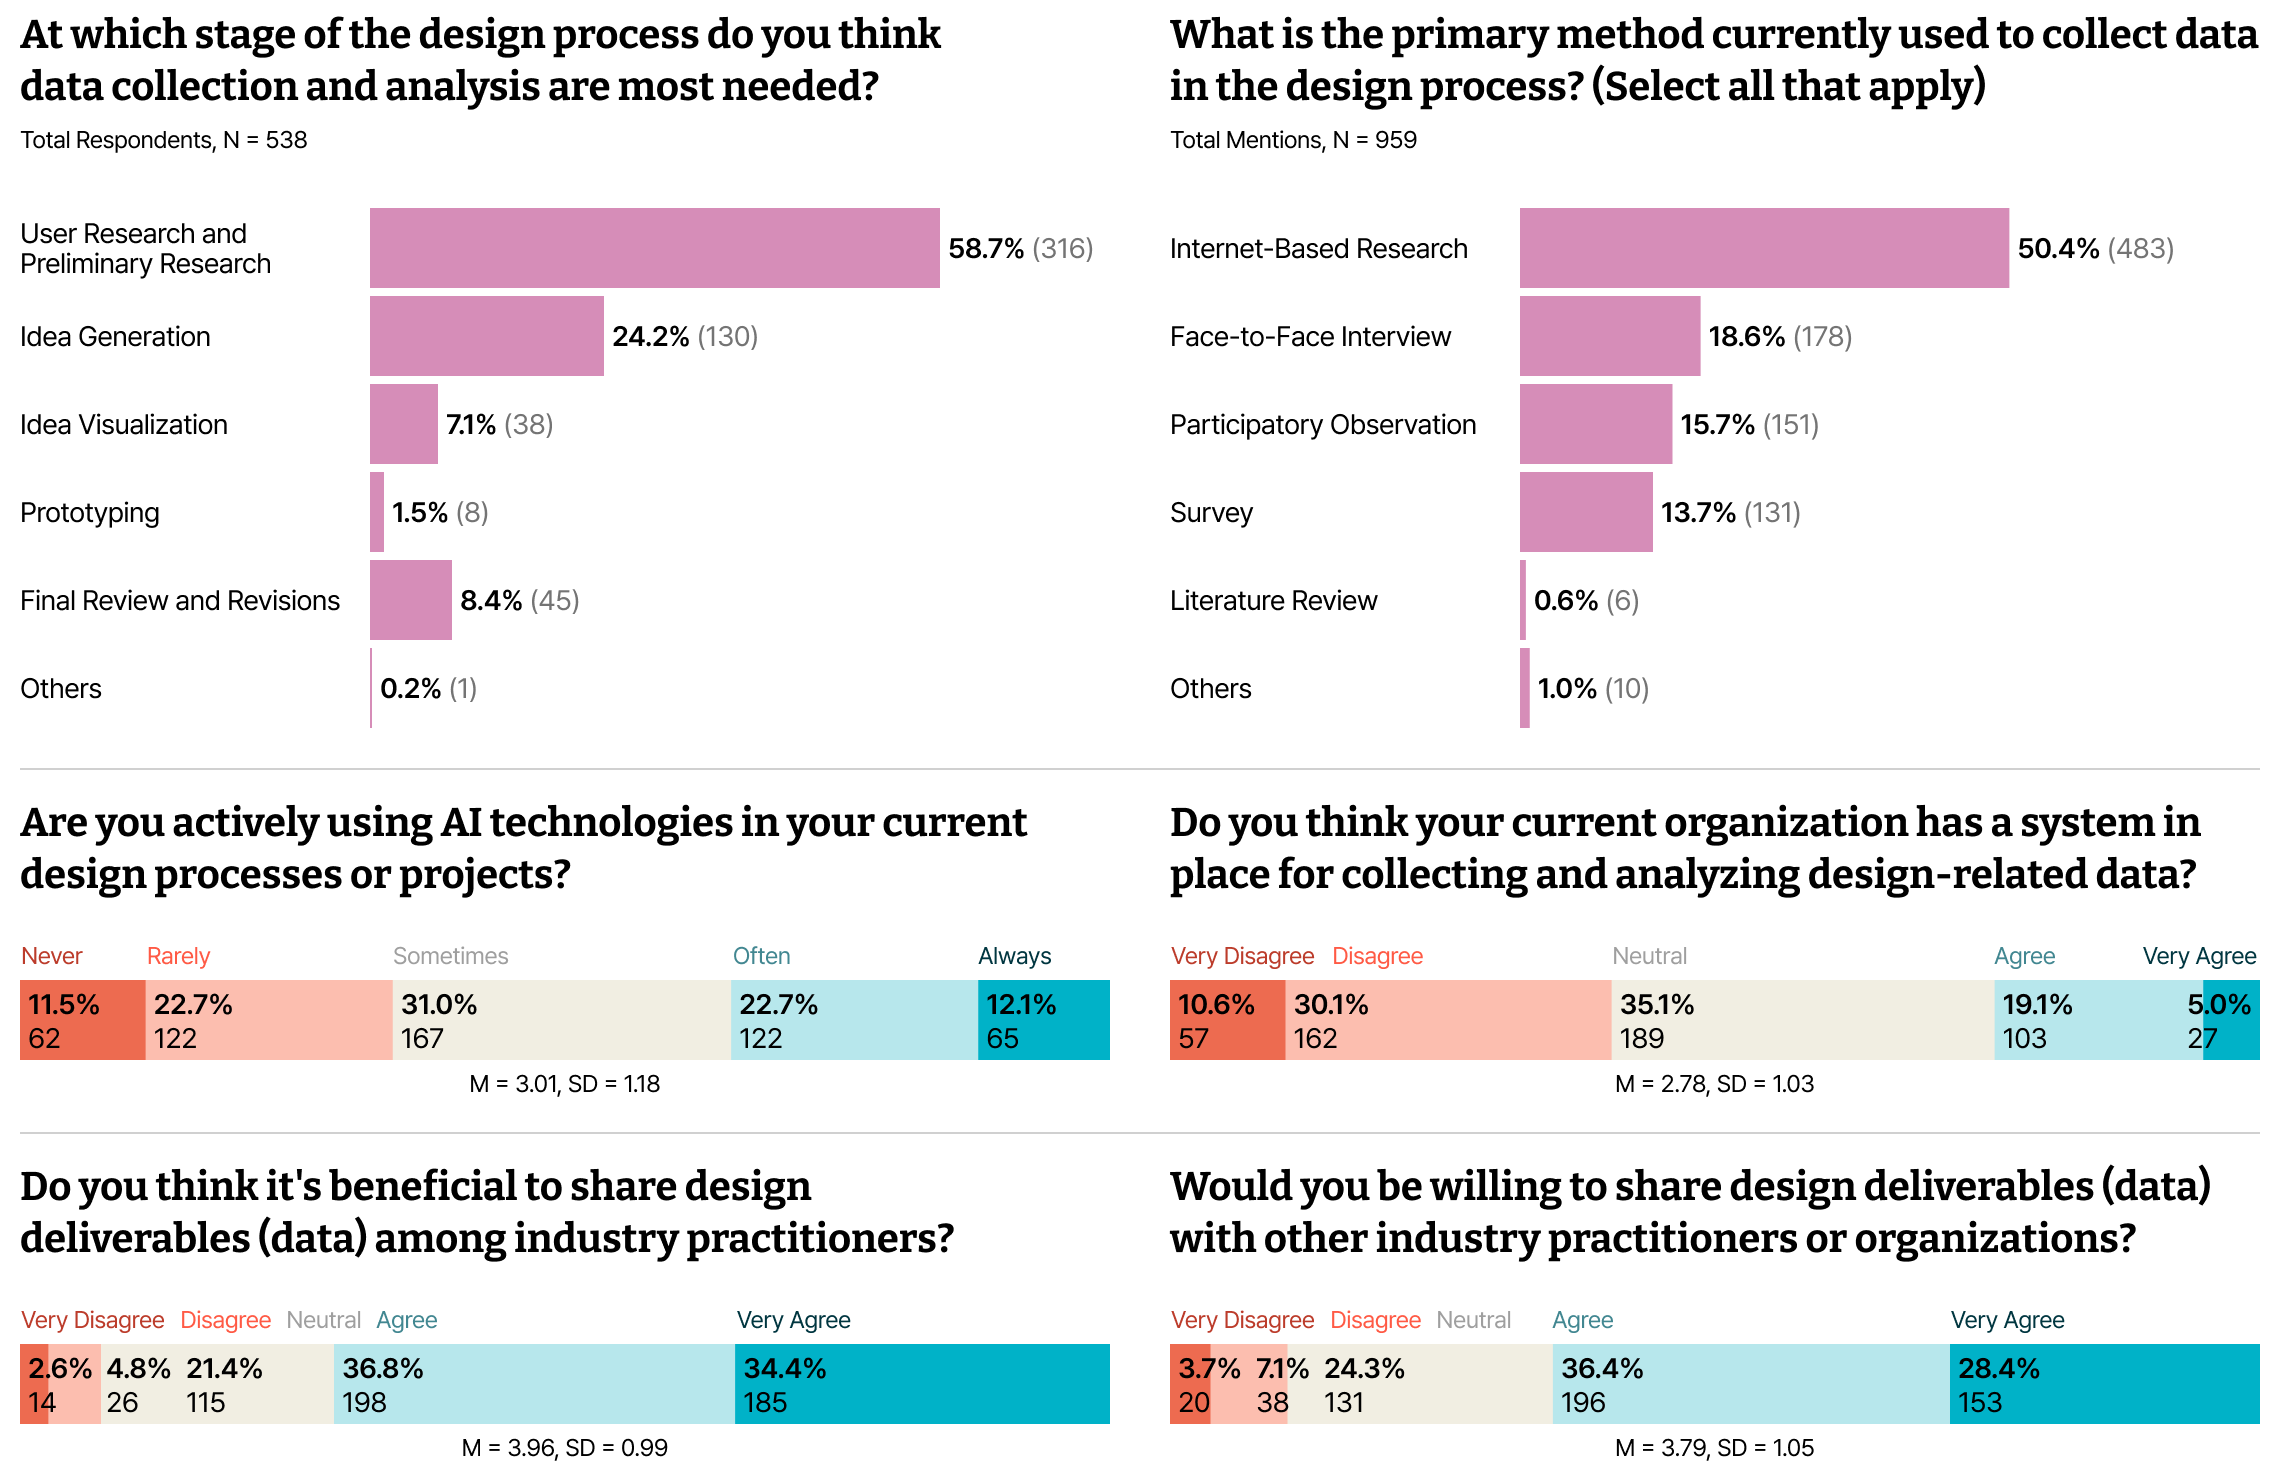
User research and background research were most often chosen as the stage where data collection was needed (58.7%). Yet respondents rated their organizations’ data collection and analysis systems at an average of just 2.78 out of 5, with more than 40% giving negative responses.
By contrast, the perceived benefits of sharing design outputs (3.96) and willingness to share them (3.79) were relatively high. There was a clear interest in using and sharing data, but not enough infrastructure to support it.
Data-Driven Design
Data was an important basis for design decisions, especially for providing evidence and opening up new perspectives.
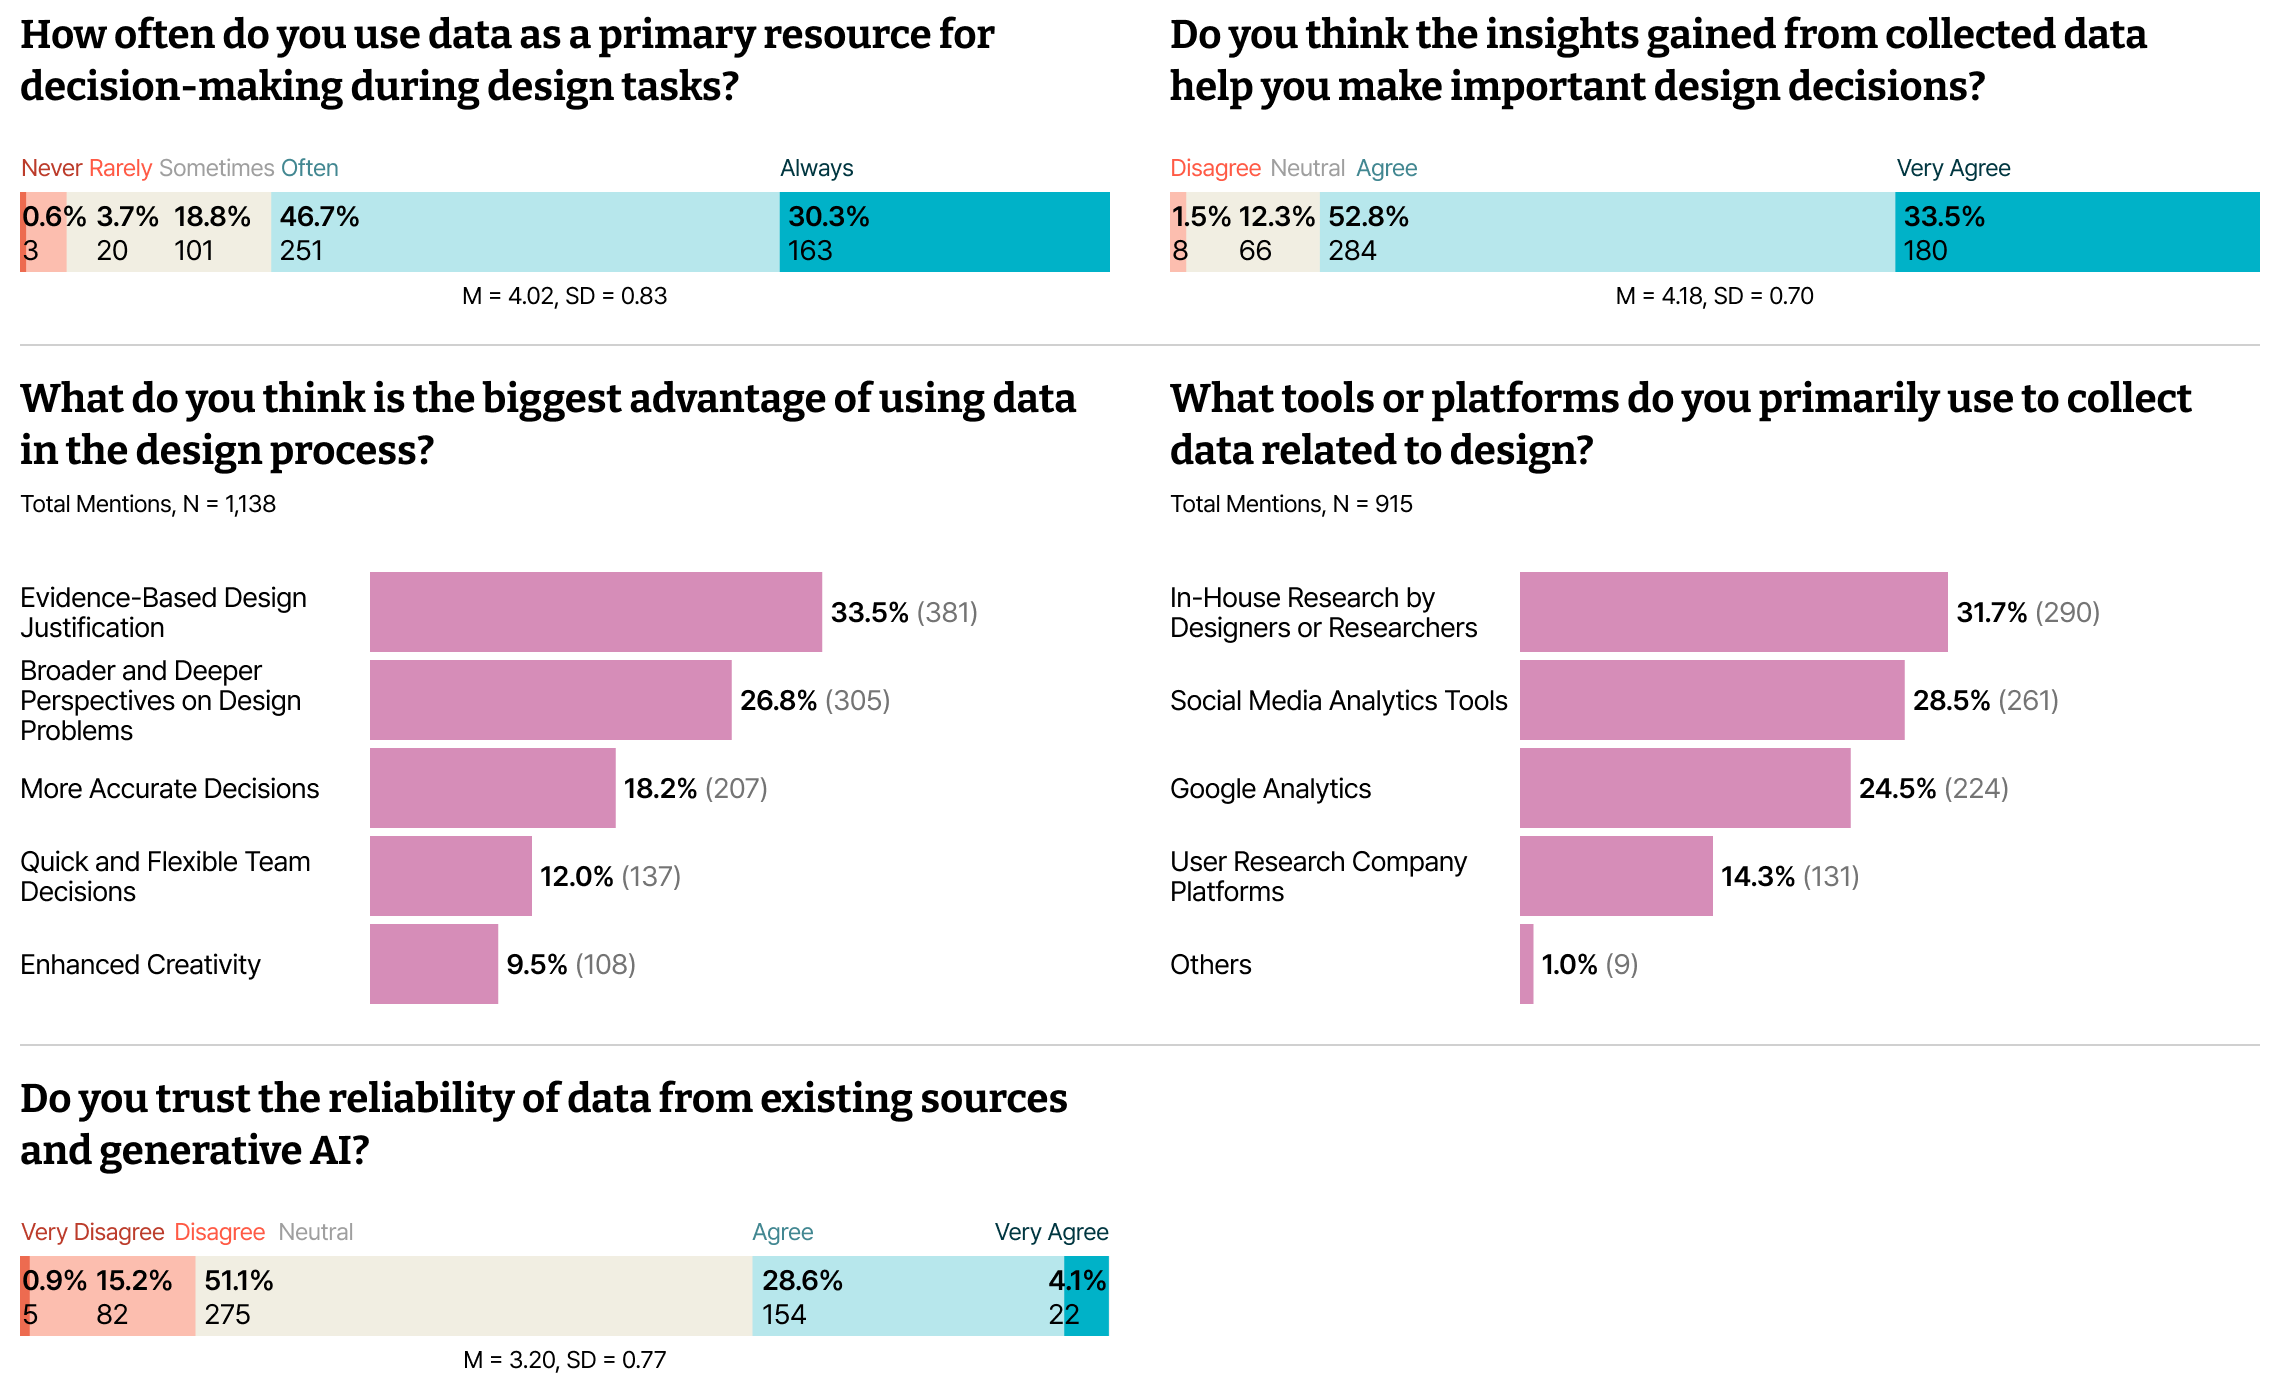
Of the respondents, 77% said they frequently or always used data in their design work. Its value in supporting decisions received an average rating of 4.18.
The most cited benefits were providing evidence for design decisions (33.5%) and broadening perspectives on a problem (26.8%). The most common ways of collecting data were conducting one’s own research (31.7%) and using social media analysis tools (28.5%).
But trust in data averaged only 3.20. The findings suggested that making data more useful would require not just easier access, but greater reliability.
AI’s Role in Design
Respondents saw AI as useful for exploring and visualizing ideas, while remaining cautious about originality and replacing human creativity.
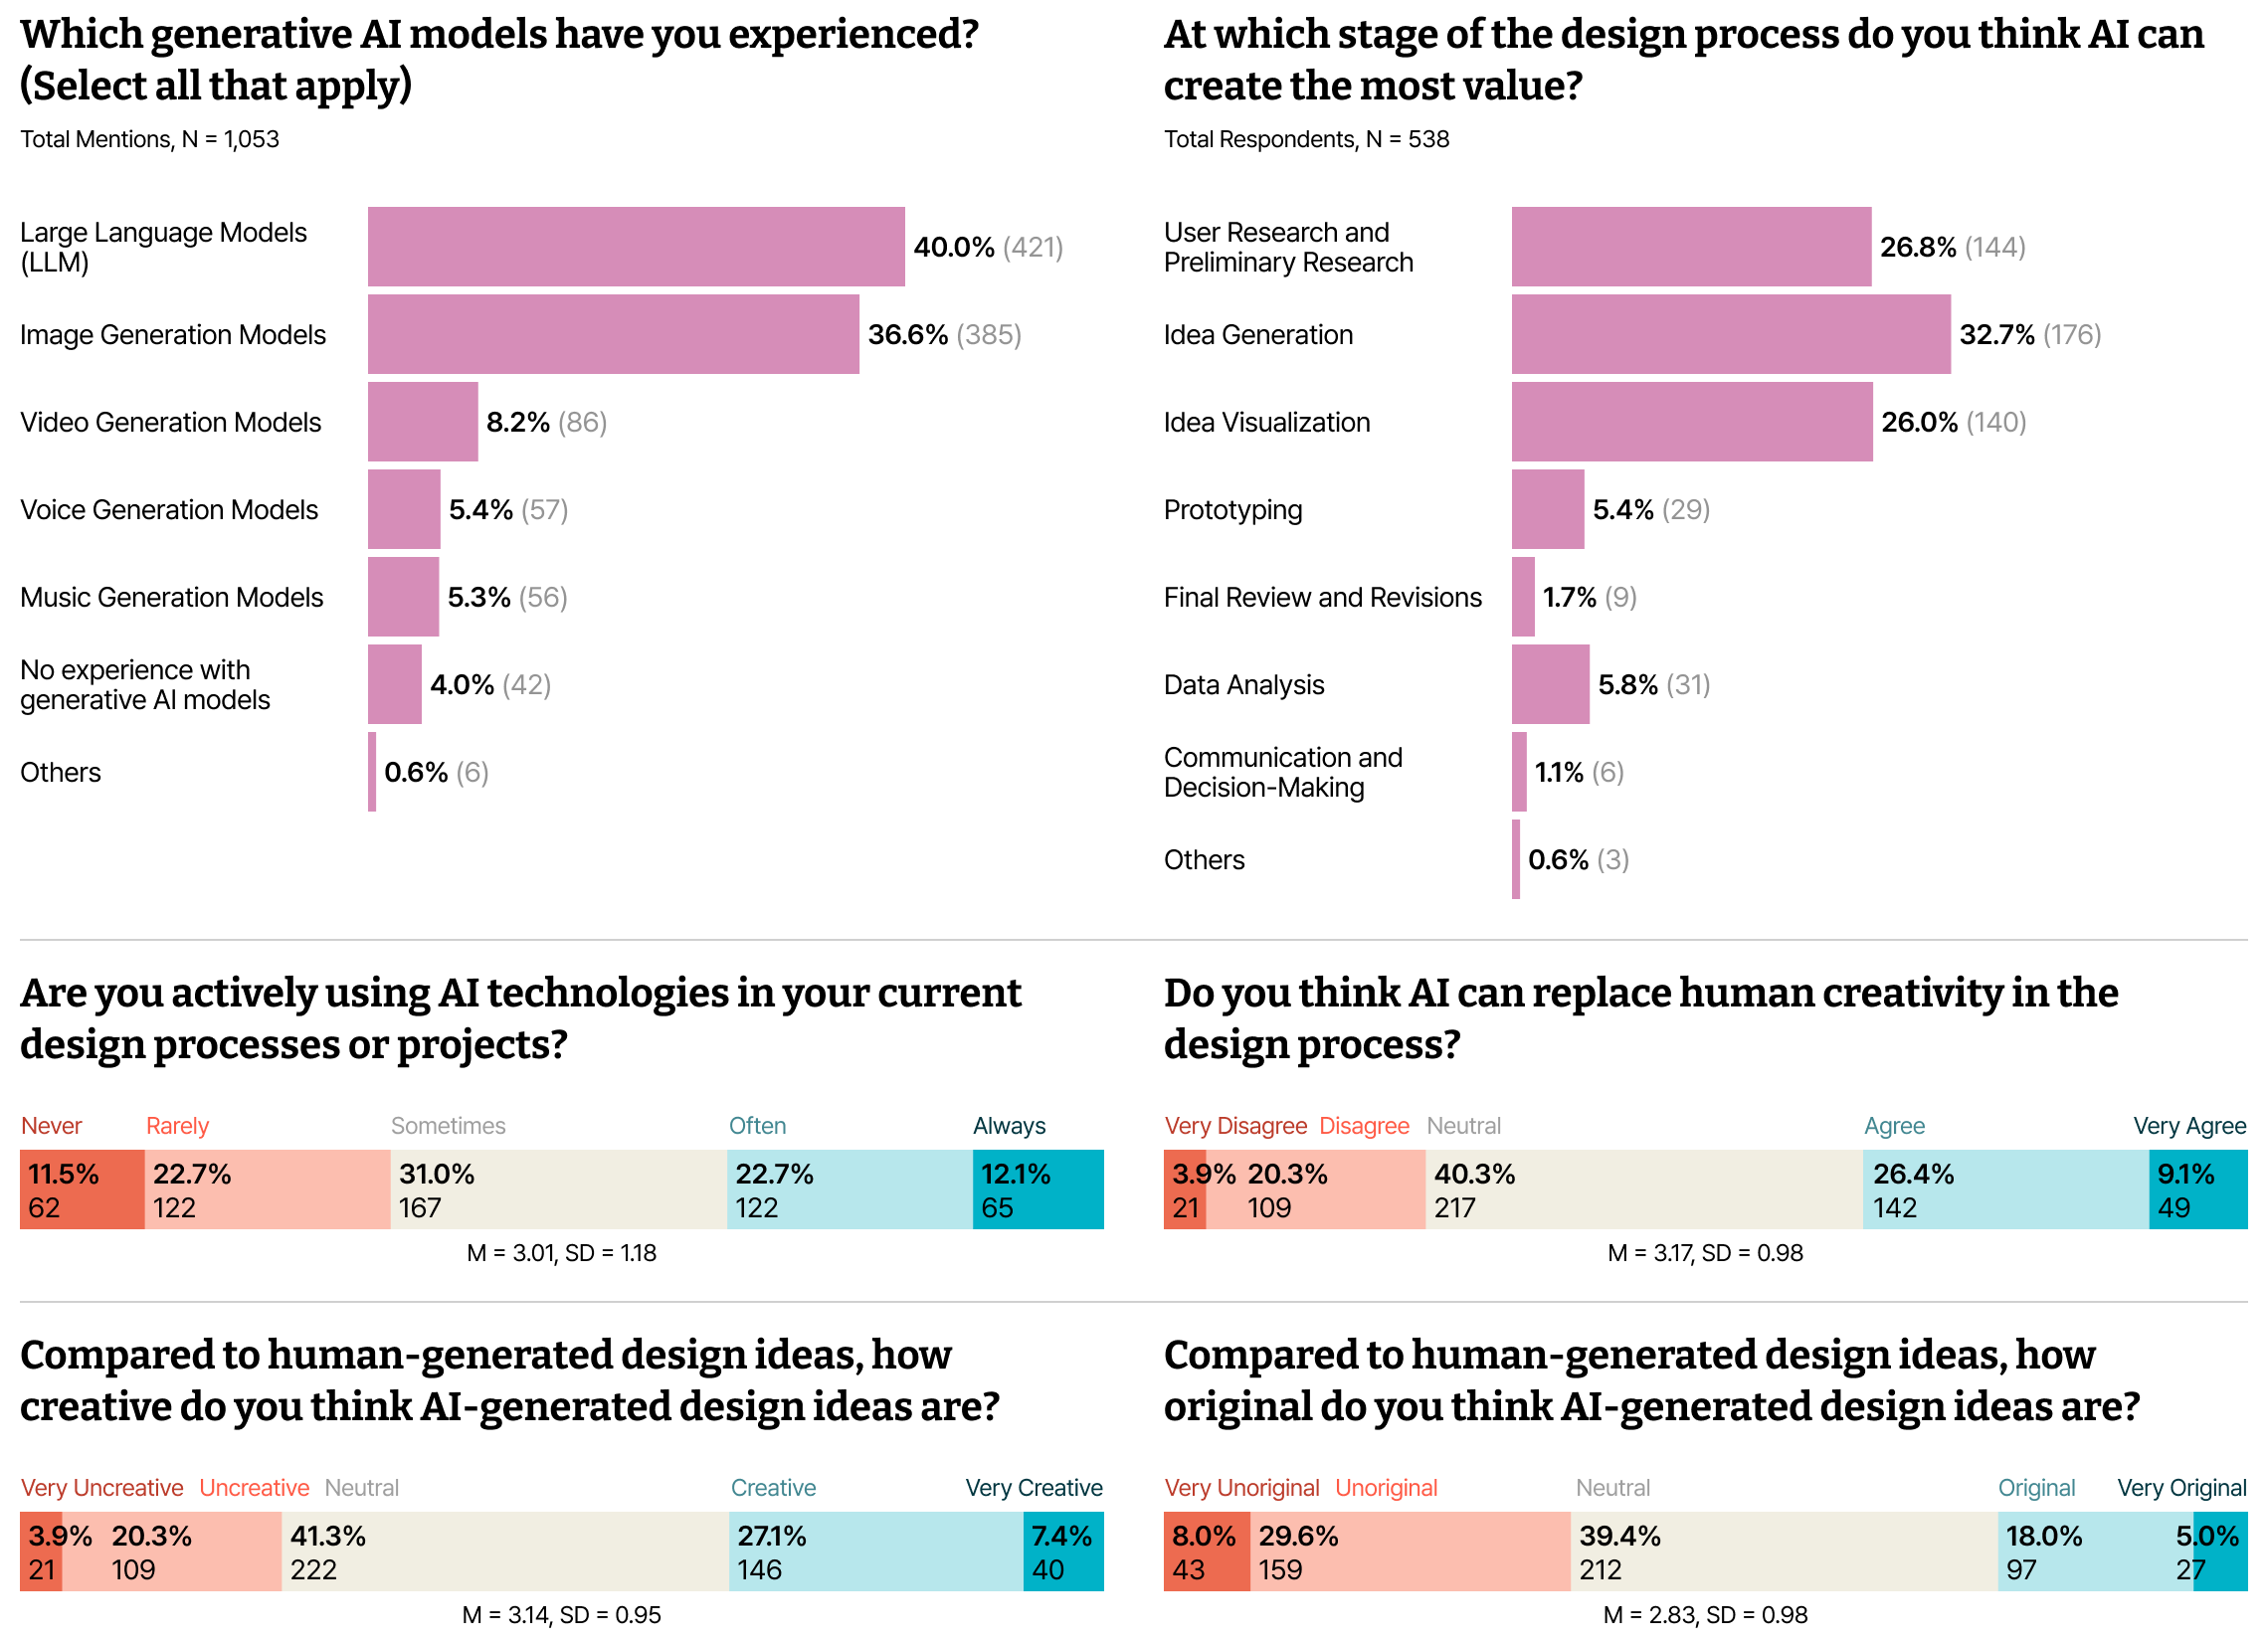
The most commonly experienced forms of generative AI were large language models (40.0%) and image generation models (36.6%). Respondents saw the greatest potential for AI in ideation (32.7%), user and background research (26.8%), and visualizing ideas (26.0%).
They were more reserved about whether AI could replace human creativity (average 3.17), and rated the originality of AI-generated ideas relatively low (2.83).
In other words, enthusiasm for AI as a tool for exploration existed alongside doubts about the originality of what it produced.
Bottlenecks in the Design Process
AI and big data were seen as ways to ease bottlenecks and make design work more efficient.
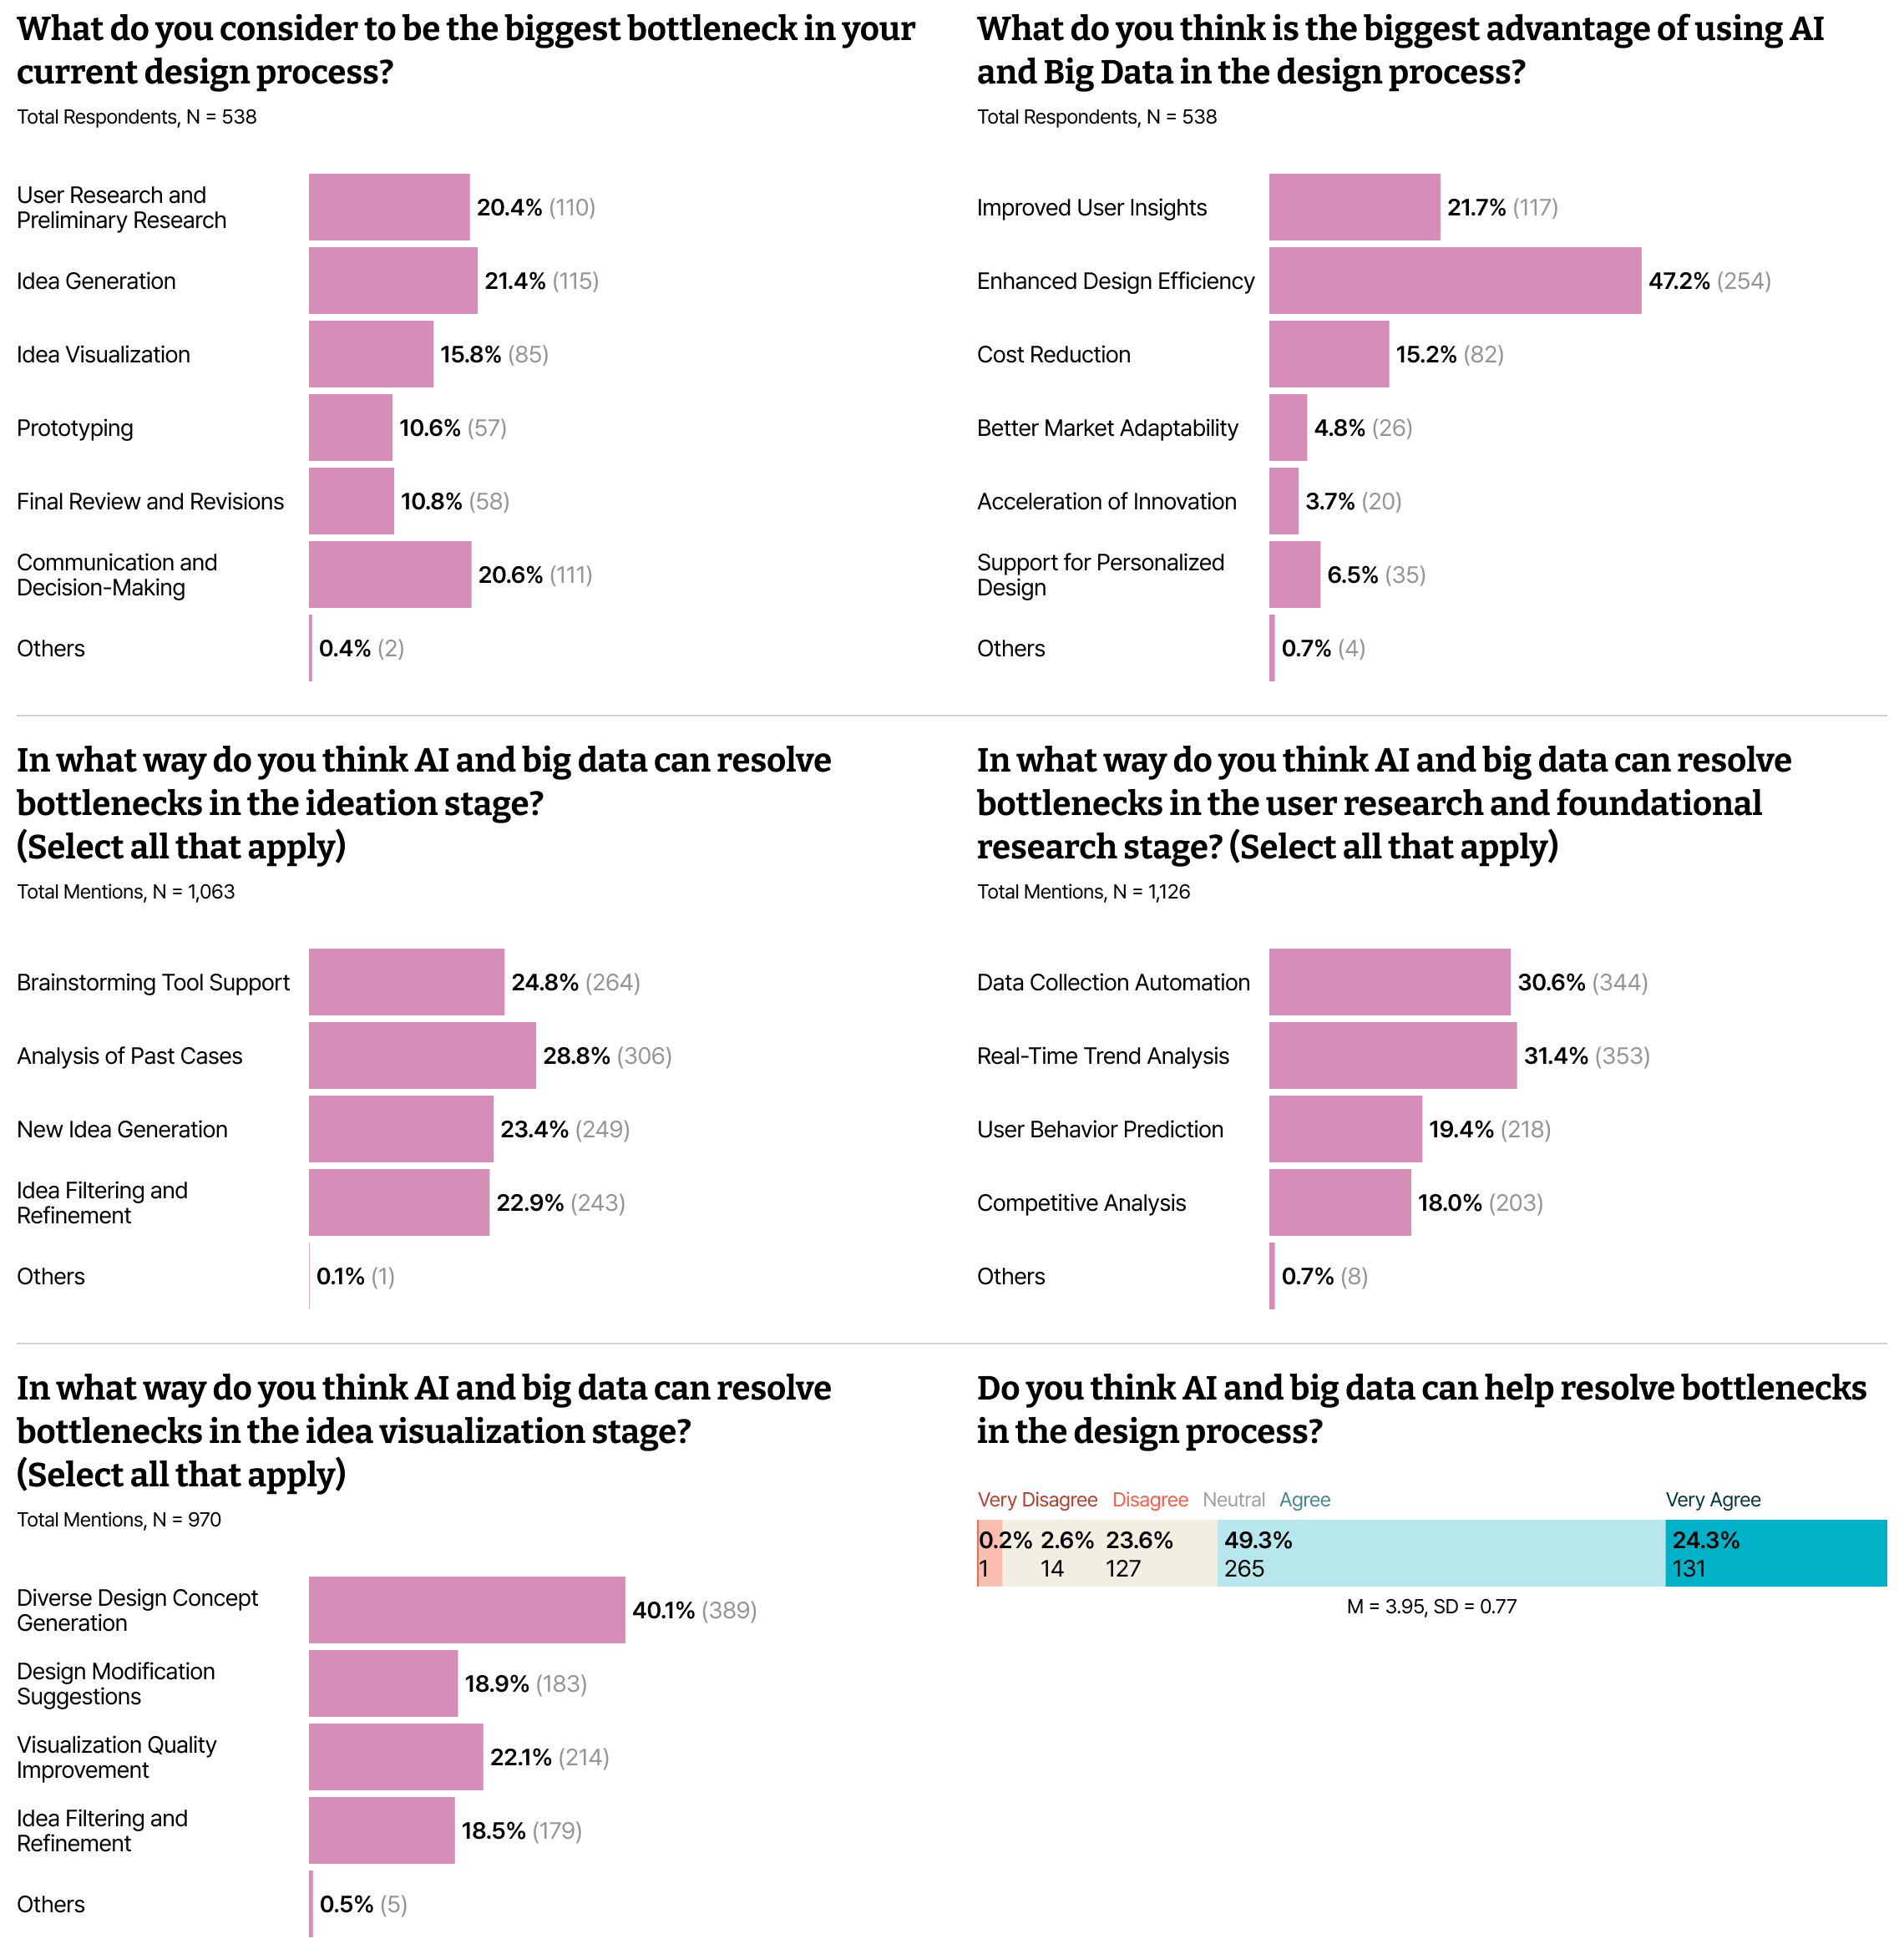
The most frequently identified bottlenecks were ideation (21.4%), communication and decision-making (20.6%), and user and background research (20.4%). Expectations that AI and big data could help address them were high, averaging 3.95.
For user research, respondents pointed to trend analysis and automated data collection. For ideation, they chose analysis of past cases and brainstorming. For visualization, they highlighted generating different design options.
The biggest perceived benefit of AI and big data was improved design efficiency (47.2%).
Skills for the Future
Expectations for AI transformation were high, but practical training and support were lagging behind.
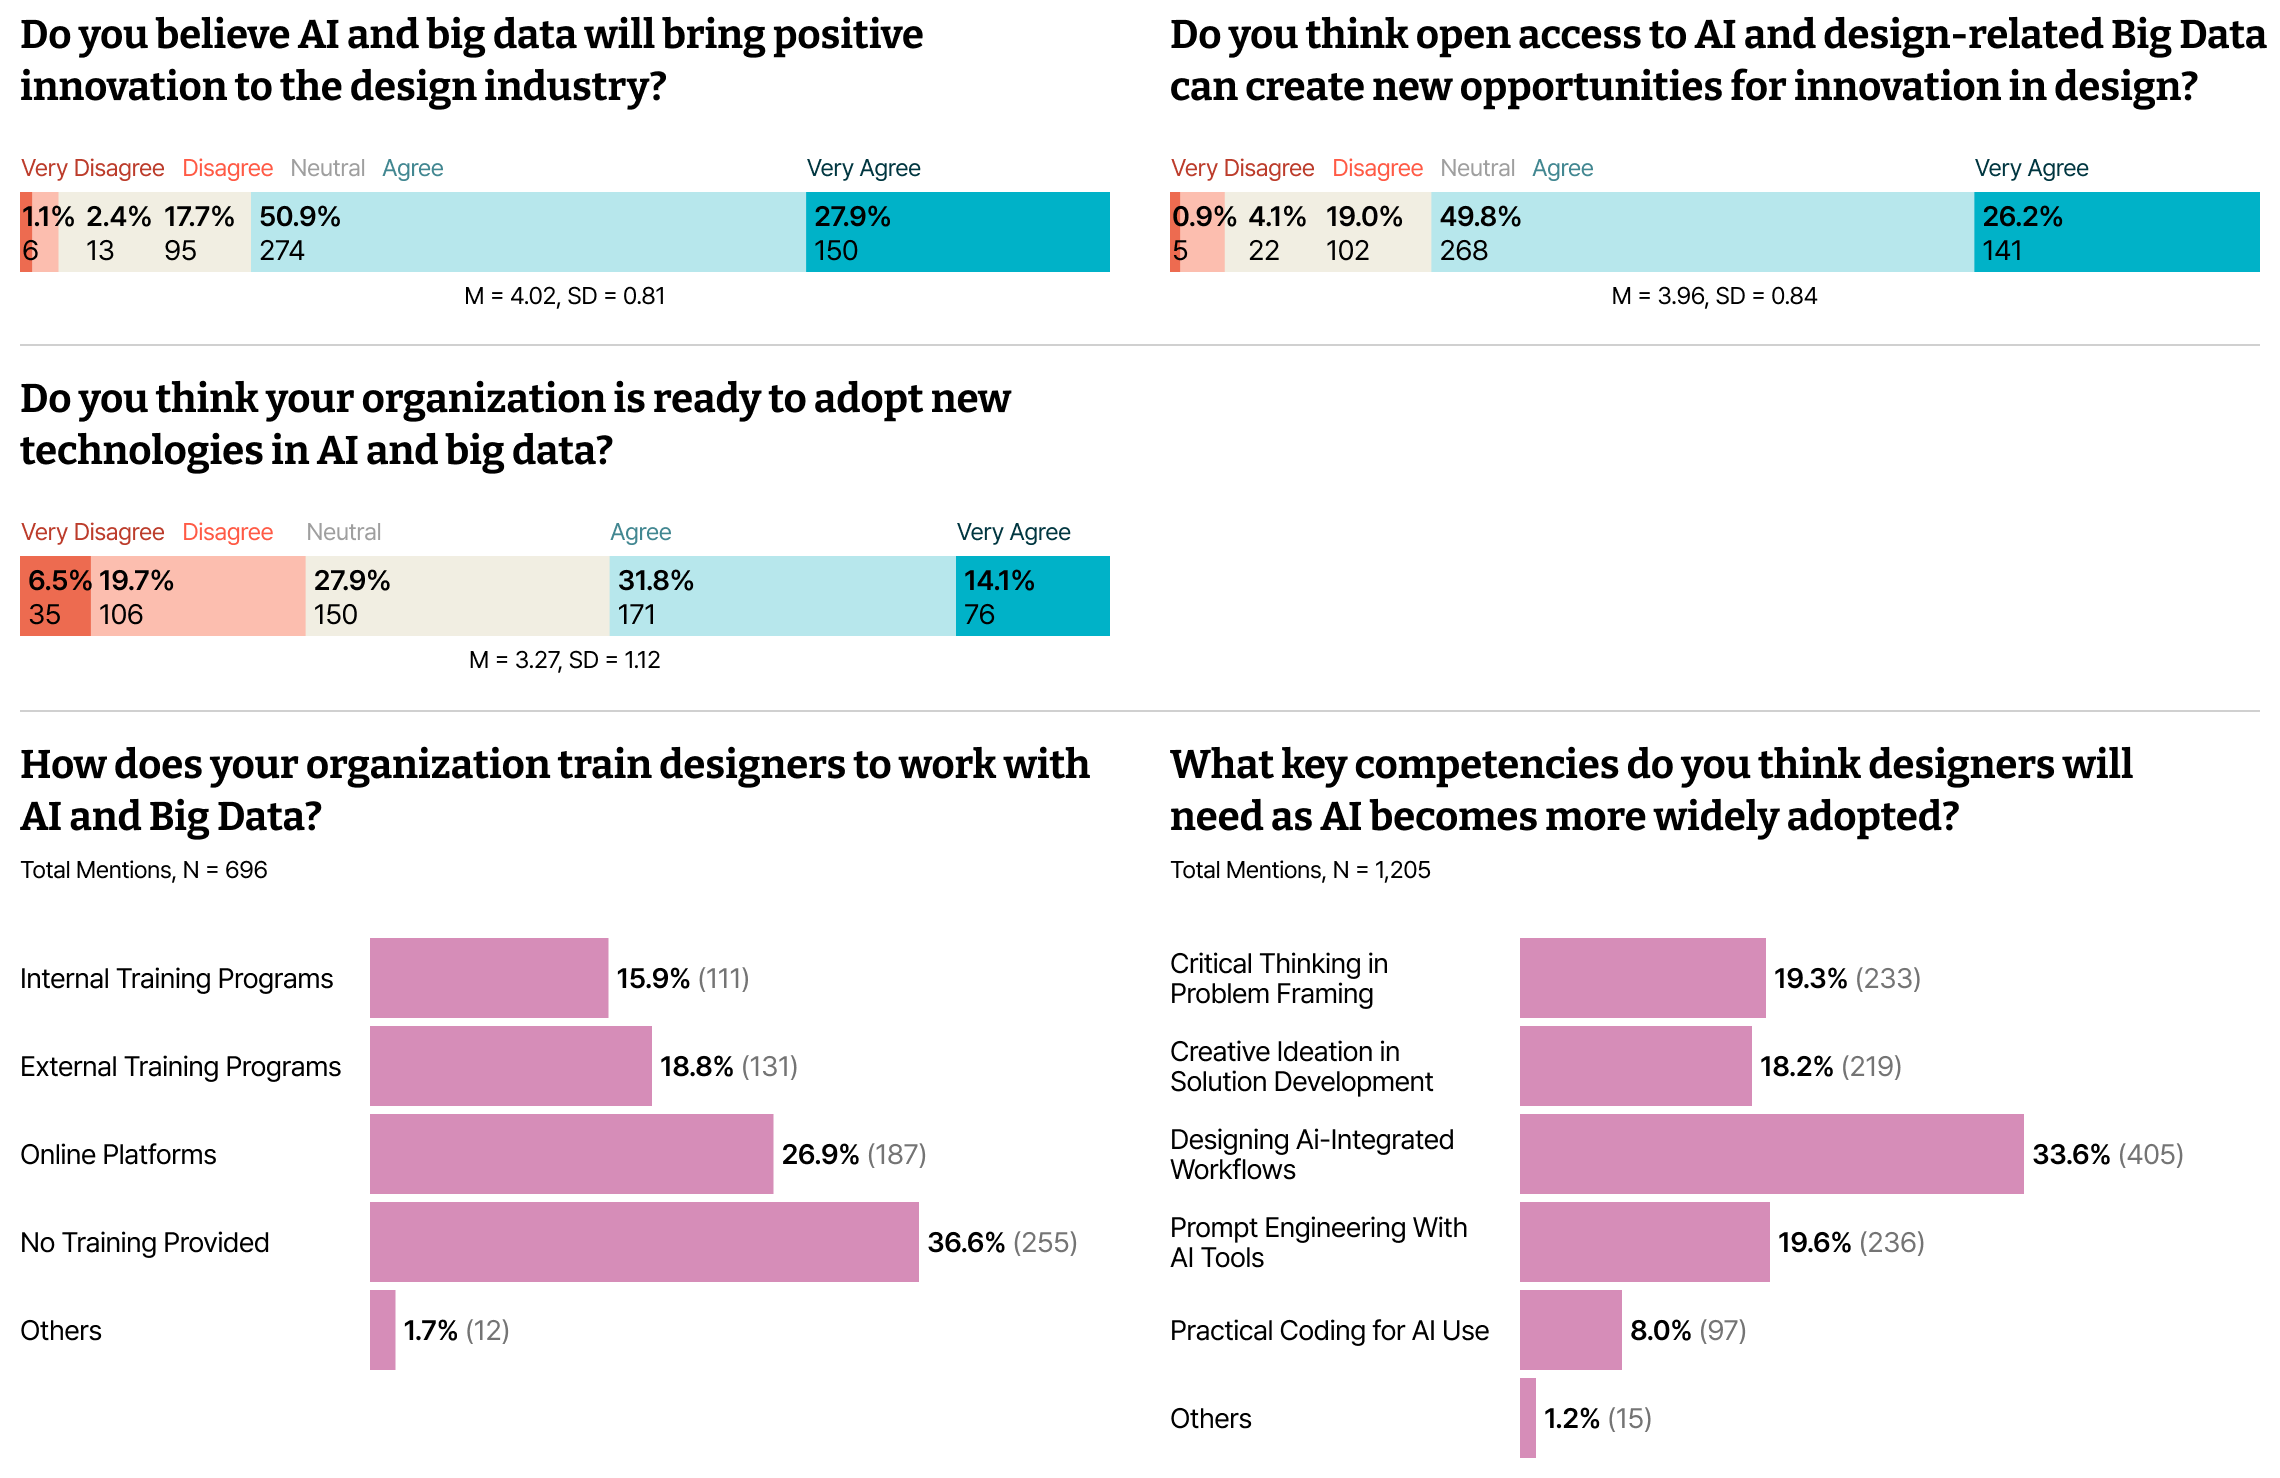
Respondents expected AI and big data to bring positive change to the design industry (average 4.02) and create new opportunities (3.96).
But when asked about training at their organizations, the most common response was no training at all (36.6%), followed by learning through online platforms such as YouTube (26.9%).
The skill most frequently chosen as essential for future designers was the ability to design new processes that bring AI and design together (33.6%). Supporting people as they develop those skills appeared just as important as enthusiasm for the technology itself.
4-2 What the Structural Equation Model Showed
We used structural equation modeling to examine how the environment for using data, hands-on experience, and perceptions of AI outputs were related.
Of the ten hypotheses, seven showed statistically significant paths.
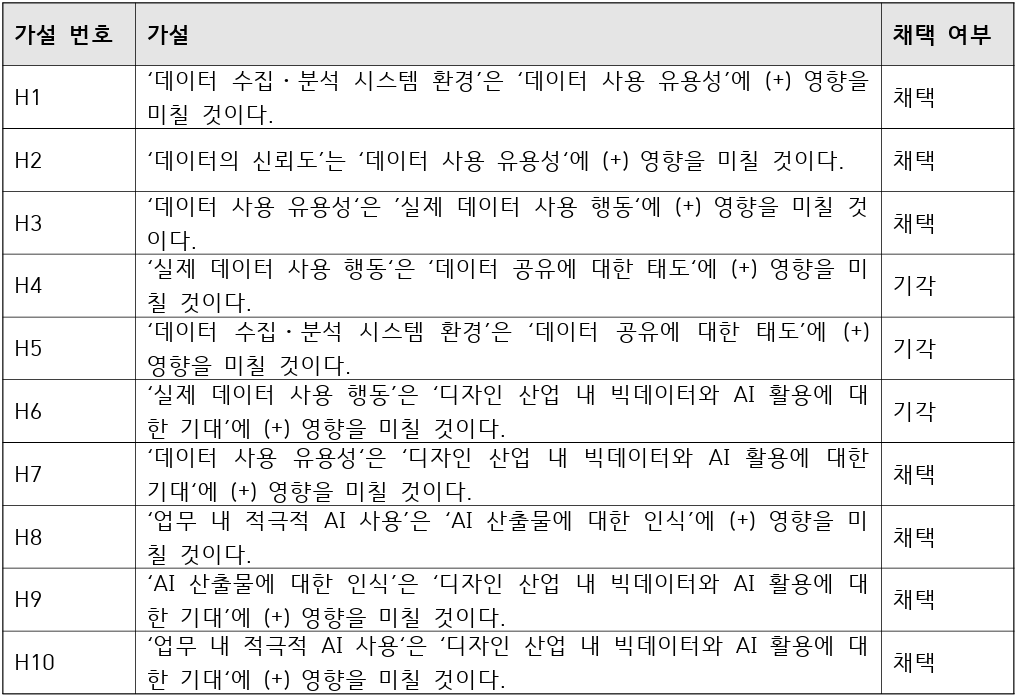 Hypothesis test results
First, better conditions for working with data were linked to greater perceived usefulness, which was in turn linked to actual use.
Organizational systems for collecting and analyzing data were positively associated with perceived usefulness (β = 0.137). Respondents who found data more useful also tended to use it more.
This highlighted the importance of both an environment that supports data use and a sense that the data is genuinely helpful.
Second, trust in data mattered in part because it made the data feel more useful.
Data trustworthiness was positively related to perceived usefulness (β = 0.180). It was also indirectly related to expectations for AI use in the industry through perceived usefulness (β = 0.083).
This suggested that trustworthy data matters not only for day-to-day use, but also for how people view the industry’s transition to AI.
Third, using AI at work was linked to stronger expectations for its future use.
Hands-on AI experience showed a positive relationship with expectations for AI in the industry (β = 0.233). We also found an indirect path through perceptions of AI-generated outputs (β = 0.072).
Using AI and evaluating what it produces seemed to matter to how practitioners viewed its potential.
Fourth, perceptions of AI-generated outputs were closely tied to expectations for AI in the industry.
How respondents viewed AI outputs showed a significant positive relationship with expectations for industry adoption (β = 0.346). Making tools available, on its own, was unlikely to be enough. People also needed to see practical value in the results.
Some proposed relationships were not statistically significant. In particular, actual data use was not directly linked to attitudes toward sharing data or to expectations for AI in the industry. Simply using data more did not necessarily translate into a stronger sharing culture or greater enthusiasm for AI.
Taken together, the findings suggested that frequency of use was only part of the picture. Trustworthy data, a supportive environment, perceived usefulness, and confidence in AI outputs all mattered.
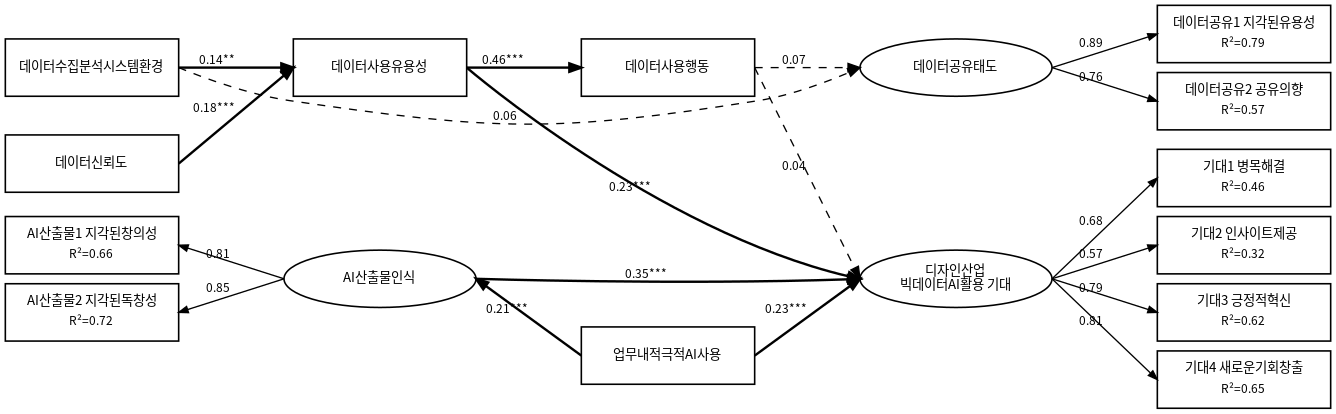 Results of the structural equation model
4-3 What We Heard in the Open-Ended Responses
Practitioners valued AI for efficiency and exploration, but struggled with control, consistency, and copyright concerns.
Respondents frequently mentioned saving time and costs, exploring a wider range of ideas, and quickly trying out visual concepts as benefits of AI in design projects.
At the same time, they described difficulty controlling AI tools, limitations in producing fine details and consistent results, and copyright concerns. One respondent noted that a tool became hard to use when it failed to understand a prompt or made larger errors with complex structures. Another said copyright issues had prevented their company from using AI-related design work. These were concrete reasons why AI had not yet become fully integrated into everyday practice.
To make collecting and sharing design data easier, respondents called for platforms, training and technical support, ways to address security and copyright concerns, and open-source or affordable resources. They also hoped the government and KIDP would provide training programs, public data platforms, financial support, and awareness campaigns.
For future designers, they emphasized AI and data literacy, proficiency with tools, adaptability and continuous learning, communication, and critical thinking and judgment.
5 Reflection
- I learned that the conditions around a technology can matter just as much as the tool itself. Practitioners were already using data actively and had some experience with AI. But adoption was held back not only by a lack of tools, but also by unreliable data, limited collection and analysis systems, copyright and security concerns, and gaps in training and guidance. I came away thinking that when designing a new service or introducing a new technology, the environment and the structures that make it trustworthy need to be in place before its features can work as intended.
- I also saw that AI’s perceived value in creative work tends to be concentrated in particular stages. Respondents valued it most for divergent activities such as ideation, early research, visualization, and organizing feedback, all of which involve uncertainty and repetition. They were more neutral about AI replacing human creativity, and rated the originality of its ideas relatively low. That made me think AI might be better positioned as a tool that supports exploration and judgment rather than one that replaces creative work. As AI evolves and new capabilities emerge, though, these perceptions may change.